
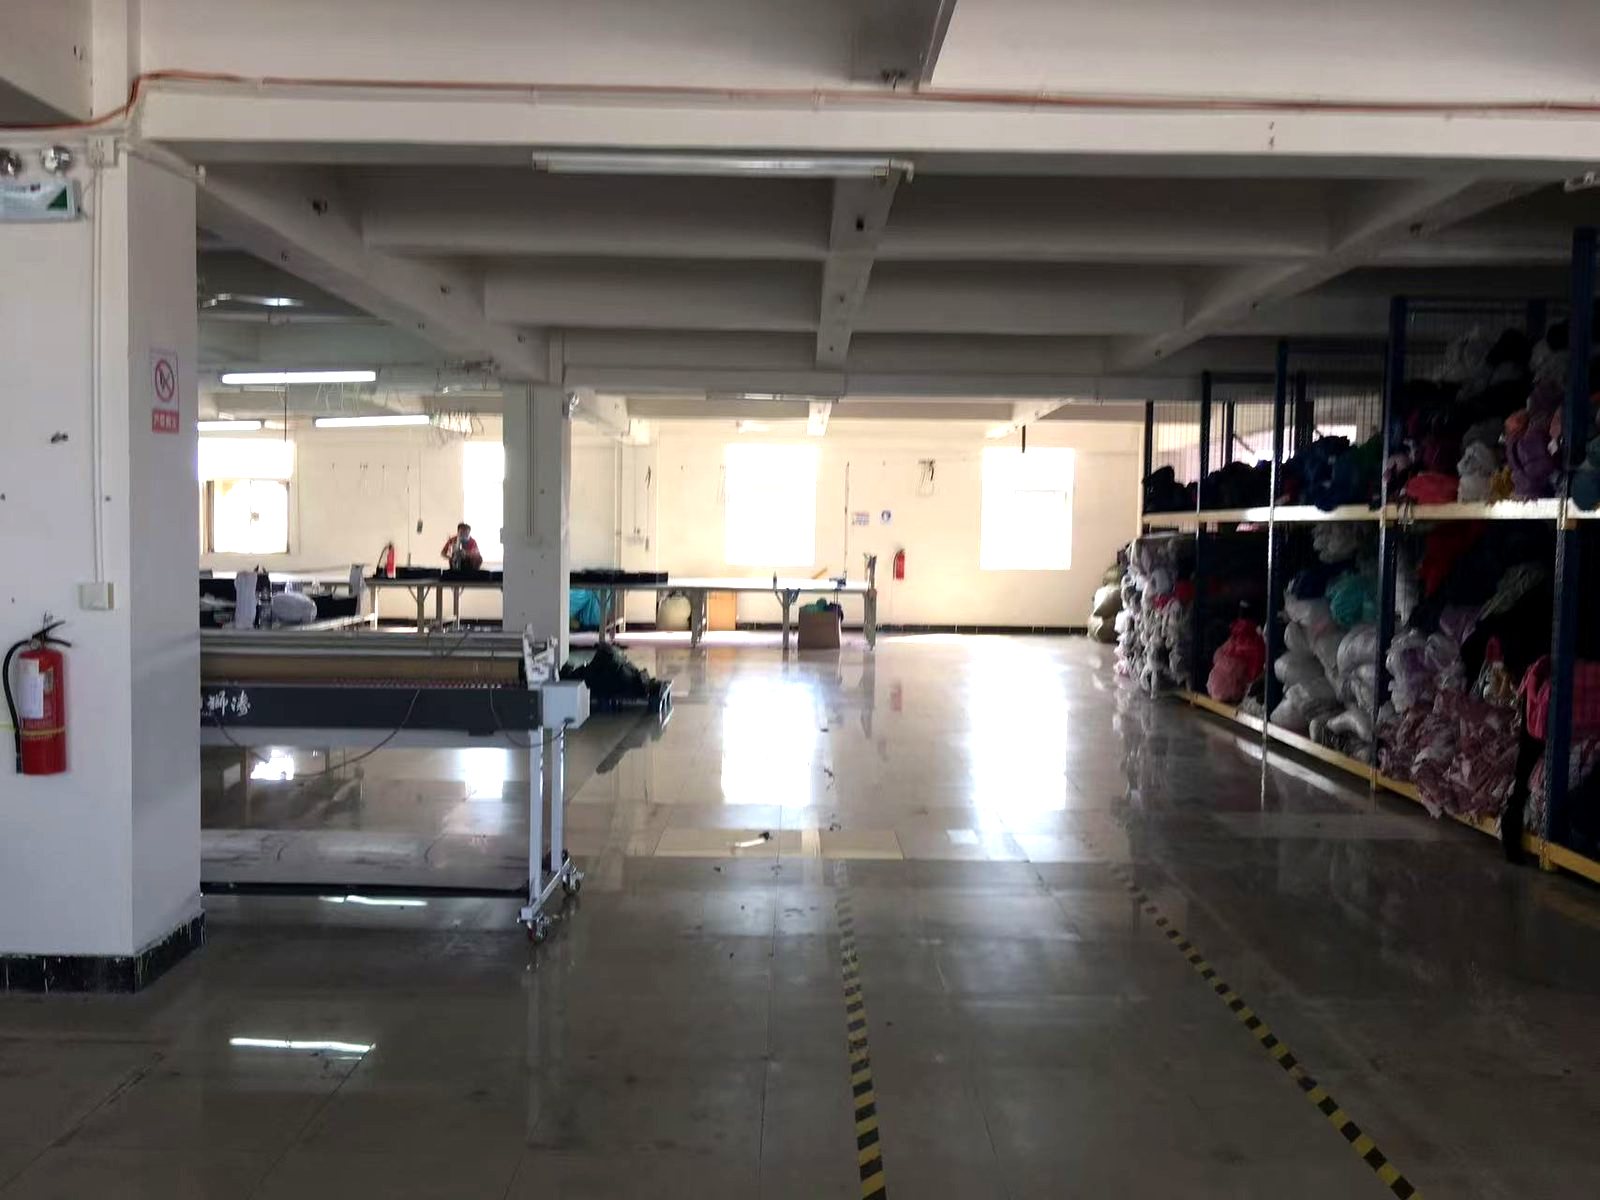
Short answer: the hidden cost of a low FOB is not a percentage somebody forgot to quote — it is the delivery variance you did not price. Two suppliers can quote the same FOB and hand you completely different tails: one ships inside the window ninety-five times out of a hundred, the other averages the same lead time and misses one order in six. Your safety stock, your launch date and your markdown exposure are set by the tail, not the average.
For a custom OEM programme, this page is about how to measure that tail from your own purchase orders, which numbers to ask for and which numbers suppliers report that mean nothing, and how to put the measurement into the order so it survives the first disagreement.
What is actually hidden in a low FOB quote?
Four things are usually outside the number, and only one of them is money.
1. The delivery window is wider than you think. A quotation gives a lead time, not a delivery date. “45 days” against what start point — order confirmation, deposit received, lab dip approved, or fabric in house? Each shifts the date by one to three weeks. If the start point is not written down, the supplier is describing an average and you are planning against a promise.
2. The ex-factory date is not the on-board date. Under FOB the risk passes when the goods are on board the vessel, not when they leave the factory; the buyer contracts the carriage, so the shipping obligation was never the supplier’s to transfer. Between the two sits booking, container allocation, trucking and port congestion — all of which can move a sailing by a week without the factory being late at all. A supplier who reports “delivered on time” without saying which of the two dates they mean has told you nothing.
3. Capacity is allocated, not reserved. A factory running at high utilisation decides whose order takes the next free line. The order that gets displaced is the one with the lowest consequence — which is usually the buyer with no measurement and no clause. This is not malice; it is scheduling under constraint.
4. Inspection failures are delivery failures. An order that fails pre-shipment inspection does not ship on the planned vessel. ISO 2859-1 decides whether the lot is accepted under the agreed sampling plan; what happens after a rejection — sorting, rework, a second inspection — is a commercial decision, and it consumes days that were never in the plan. Buyers rarely count this in the supplier’s on-time performance, which is exactly why suppliers do not either.
| What the quote says | What it leaves open | What you should ask instead |
|---|---|---|
| “45 days production” | Start point of the clock | Days from which event, and what stops the clock |
| “We always deliver on time” | Which date is being measured | Ex-factory readiness date, or on-board date |
| “Our capacity is flexible” | Who gets displaced when it is not | How many lines, and what the peak-season booking cut-off is |
| “Quality is our priority” | What happens when a lot fails | Re-inspection window, and who owns the missed sailing |
What does OTIF mean, and why do suppliers report it differently?
OTIF — on time, in full — is two conditions in one number, and both halves need a definition before the number means anything.
On time needs a reference date and a tolerance. The workable definition is the ex-factory readiness date stated in the purchase order, measured to the day, with the shipping window treated separately. Measuring to the vessel’s departure drags carrier performance into a supplier’s score and makes the number unmanageable for both sides.
In full needs a unit of account. Pieces against the purchase order is the obvious one and the weakest: an order can arrive at full piece count with three sizes short and two colours over. The stricter definition is complete against the order line — every style, colour and size ratio present in the quantity ordered. That is the definition a retail buyer needs, because a size gap is a stockout on the shelf even when the carton count reconciles.
The number itself is a ratio, not a promise. OTIF = orders meeting both conditions ÷ orders shipped in the period. The denominator matters: a supplier who counts only the orders they chose to report will show a better number than one who counts everything. Ask for the denominator and the period.
No OTIF figure is quoted on this page for any supplier, including us: the method is the claim, and any number we give comes with its period, its order count and the definition used.
When a supplier quotes an OTIF figure without a definition, treat it the way you would treat a shade approval without a light source — the claim may be true under conditions you cannot see. The version you can rely on is the one you compute yourself from your own order history, which is covered further down.
Why is the average lead time the wrong number to plan from?
Because a launch date is a deadline, not an expectation. If a supplier’s lead time averages 50 days with a standard deviation of 8, then — assuming a roughly normal distribution, and real lead times usually carry a longer right tail, so treat this as a floor — about one order in six lands beyond 58 days and about one in forty-four beyond 66. Planning to 50 means planning to fail on a sixth of your orders, and 58 days is not the P90 either: with those parameters the P90 sits at about 60 days.
The planning number is the upper tail — the date by which 90% of orders have shipped, often written P90. It is computed from your own delivery records, not from a supplier’s quoted lead time, and it is almost always longer than the quote. That gap is the hidden cost of the low FOB: the supplier with the tighter quote frequently has the fatter tail, because tight quotes are won by promising the average and not by shortening the variance.
The consequence is measurable even if you never model it formally. Safety stock that covers lead-time uncertainty scales with the standard deviation of the lead time, not with its mean:
Safety stock ≈ z × σLT × average daily demand
where z is the service-level factor (about 1.28 for 90%, 1.65 for 95%, 2.33 for 99%) and σLT is the standard deviation of your lead time in days. Compute the P90 itself by sorting your last twenty readiness dates and taking the value at the 90th percentile; do not extrapolate it from the mean. Doubling σLT doubles the buffer you must carry to hold the same service level. Nothing in that formula refers to the unit price, which is why a 3% FOB advantage can be wiped out by a wider tail without anyone noticing it on the quotation sheet.
| Measure | What it tells you | What it hides |
|---|---|---|
| Quoted lead time | What the supplier would like you to plan to | Everything about the distribution around it |
| Mean actual lead time | Central tendency of past orders | The tail, which is what misses your launch |
| P90 lead time | The date 90% of orders shipped by | Nothing important; this is the planning number |
| σLT | How much buffer you need to carry | Whether the variance is yours to control or the supplier’s |
| OTIF, defined | Whether both time and completeness were met | How bad the misses were, unless you also record the days late |
Which cost legs does a late container actually create?
Four, and they behave differently. The first two are visible and arrive once; the last two are invisible and compound.
Markdown exposure. Goods that arrive after the selling window do not sell at full price. The exposure is the share of the order that misses the window multiplied by the discount needed to clear it. Both inputs are yours, which is why no supplier can price this for you — and why the number is routinely left out of the sourcing decision.
Air freight. The standard recovery for a late order is to fly part of it. Air freight is priced by chargeable weight, and for a dense cotton product the volumetric ratio determines whether you pay for weight or volume — a carton of folded briefs is heavy relative to its size, so the chargeable weight usually follows the actual weight. The cost is not a fixed multiple of sea freight; it depends on the lane and the season, so compute it per shipment rather than assuming a ratio.
Lost repeat business. A retail account that misses a season does not usually re-order the same programme. This leg is the largest and the least quantifiable, which is why it gets ignored in favour of the two above.
Working capital and storage. Goods that arrive early are also a cost — warehouse space and tied-up cash — and buyers who push hard for early delivery discover this leg afterwards. The optimum is not “as early as possible”; it is inside the window.
A workable way to make the comparison on paper: for each candidate supplier, write the P90 lead time, the OTIF you have measured or been given with its definition, and the markdown share that a P90 miss would trigger. The supplier with the lower FOB wins only if the difference exceeds the carrying cost of the extra buffer. In most programmes with a fixed launch date it does not.
Where does lead-time variance come from?
Variance is produced by specific steps, and each has a different owner. Naming the step is what makes a delivery conversation useful, because “you were late” ends in an argument while “the lab dip approval took nine days and the plan assumed four” ends in a decision.
| Source of variance | Who controls it | How it shows up |
|---|---|---|
| Lab dip and strike-off rounds | Shared — buyer approves, mill dyes | Each extra round adds days before bulk can start |
| Fabric in house vs fabric to be developed | Supplier | Greige availability sets the earliest dye date |
| Dyehouse queue in peak season | Supplier | Booking moves; the order is not late until the bath is late |
| Print screen or plate making | Supplier | Per-colour setup, and a re-make restarts the queue |
| Trims and elastic lead time | Supplier and their sub-supplier | Waistband weaving is often the critical path, not sewing |
| Pre-shipment inspection failure | Supplier | A rejected lot consumes the sailing window for sorting |
| Chinese New Year shutdown | Neither, but predictable | Fixed calendar effect; planning error if it is not in the plan |
| Booking and vessel space | Carrier and forwarder | Moves the on-board date without moving the ex-factory date |
Two of these deserve their own treatment because they are the ones buyers most often leave out of the plan. The first is the inspection outcome: a lot that is not accepted under the agreed sampling plan has to be sorted, and sorting is measured in days per thousand pieces. The second is the calendar.
How does the Chinese New Year calendar enter the calculation?
It is the one variance source with a known date and an unknown length, and it is a wall rather than a delay: work either finishes before it or restarts after, and the two outcomes differ by weeks. The restart-week logic, the travel pattern around it and how to date the second half of an order from it are set out in our 120-day cycle guide. For this page the only point that matters is that a quoted day count which ignores the holiday is not a plan.
How do you measure a supplier’s delivery performance from your own orders?
You do not need the supplier’s data, and using your own removes the definitional argument entirely. The method is four columns and a spreadsheet.
- Record the promise. For every order, write the ex-factory readiness date from the purchase order, not the date the supplier later mentions in an email.
- Record the event. Write the date the goods were actually ready for inspection or collection, evidenced by the inspection booking or the forwarder’s collection note. This is the date the supplier controls.
- Record completeness separately. Pieces received against pieces ordered, and whether every style, colour and size in the order line was present. Do not net a size shortfall against a size overage.
- Compute on a rolling window. Twelve months or the last twenty orders, whichever comes first. Report on-time rate, in-full rate, OTIF, and the mean and standard deviation of the lateness in days for the orders that missed.
Twenty orders is the practical minimum because a rate computed on three orders is a story, not a measurement. Below twenty, report the raw list instead of a percentage — a buyer who says “nine of my last eleven orders arrived after the promised date, by four to nineteen days” is more credible to a sourcing director than any percentage, and it is also harder to argue with.
What belongs in the order so the measurement is enforceable?
Four fields and one mechanism. They belong in the purchase order, because an email thread is not a document either side can rely on eighteen months later.
- The reference date and its clock start. State the ex-factory readiness date, and state which event starts the countdown: purchase order signed, deposit received, lab dip approved, or fabric in house. If the clock stops for buyer approvals, say so and say for how long.
- The completeness definition. Order line complete means every style, colour and size ratio present, not merely the total piece count. Write the tolerance for over- and under-delivery as a percentage of the order line.
- The measurement window for reporting. Ask for the supplier’s own on-time record on the same definition, over a stated period and a stated number of orders. A record with no denominator is not a record.
- Care labelling, because it travels with the delivery. Care instructions are part of the pack that ships with the goods: in the United States 16 CFR Part 423 requires them on the label, and a missing care label is a compliance failure independent of whether the container was on time.
- The consequence. State what happens when the date is missed — a credit, a share of the air freight, a priority slot on the next order, or the right to cancel the balance. The form is your choice; what matters is that it exists before the first miss rather than being negotiated during it.
The mechanism that makes all four real is the same one covered in our claim and replacement timeline: a dated record, kept by the buyer, of what was promised and what happened. Suppliers respond to buyers who can produce that record, because the conversation stops being about recollection.
What does this mean for a first order and a repeat order?
First order. You have no delivery history, so you cannot compute a tail. Substitute proxies: how many of the last five orders the supplier will show you, whether the ex-factory dates were met on those, and whether the fabric was in house or to be developed. A first order with fabric to be developed and a print has two variance sources stacked on top of each other; the same order in a stock fabric has one.
Repeat order. Here the tail is yours to measure, and the repeat is also where the low-FOB supplier usually diverges from the reliable one. The repeat has no sampling stage, no new marker and no new print setup, so its lead time should be materially shorter and far more stable. A repeat that is as variable as the first order tells you the first order’s stability was luck.
Second season. The programme is now a series, and the useful question changes from “were you on time” to “how did your misses distribute”. A supplier who misses by three days four times is easier to plan around than one who misses once by five weeks, even though both may show the same on-time rate. Record the days late, not just the flag.
How does this connect to lot control and inspection?
Delivery performance and batch consistency are two views of the same discipline. A supplier who can tell you which lot your goods came from can usually tell you which week it was dyed, which is the input to every lead-time estimate. A supplier who cannot answer the lot question is estimating the calendar as well.
That is why the measurement in this page and the lot questions in order size and batch consistency are worth asking together. Both are answered from records, both fail the same way when records do not exist, and both are cheap to verify before an order and expensive to discover after one.
For a buyer comparing quotes, the sequence that works is: fix the definition, ask for the record, compute the tail from your own orders, and only then compare the FOB. The 12-point supplier scorecard covers the wider set of checks; this page covers the one that decides whether your launch date survives. The production calendar we plan against, including the reverse-planning figures and the category minimums that set the earliest feasible start, is on the production timeline page.
References
- ISO 9001:2026 — quality management systems, requirements, published 16 September 2026 and superseding the 2015 edition. iso.org
- ISO 2859-1 — sampling procedures for inspection by attributes, lot definition and switching rules. iso.org
- UNCITRAL — CISG, Article 33 on the time for delivery and Articles 45 to 77 on remedies and damages. uncitral.un.org
- ICC — Incoterms 2020, FOB and the point at which risk passes. iccwbo.org
- ISO Online Browsing Platform — ISO 6330 and ISO 5077, the washing and dimensional-change methods behind a shrinkage claim. iso.org/obp
- OEKO-TEX — STANDARD 100, the certification held by our partner factories. oeko-tex.com
- amfori — BSCI, the social audit held by our partner factories. amfori.org
- US eCFR — 16 CFR Part 423, care labelling of textile wearing apparel. ecfr.gov
Next step
If you are comparing two quotes and the difference is small, ask both suppliers for the same three things: the reference date and its clock start, their on-time record with its denominator, and their restart week if the delivery straddles Chinese New Year. The answers separate a quote from a plan. To see the calendar those answers should be built on, start with the production timeline, and to test the record-keeping side, use the supplier verification checklist.
· Xiamen Unitex Trade Co., Ltd. — OEM & ODM underwear sourcing partner